
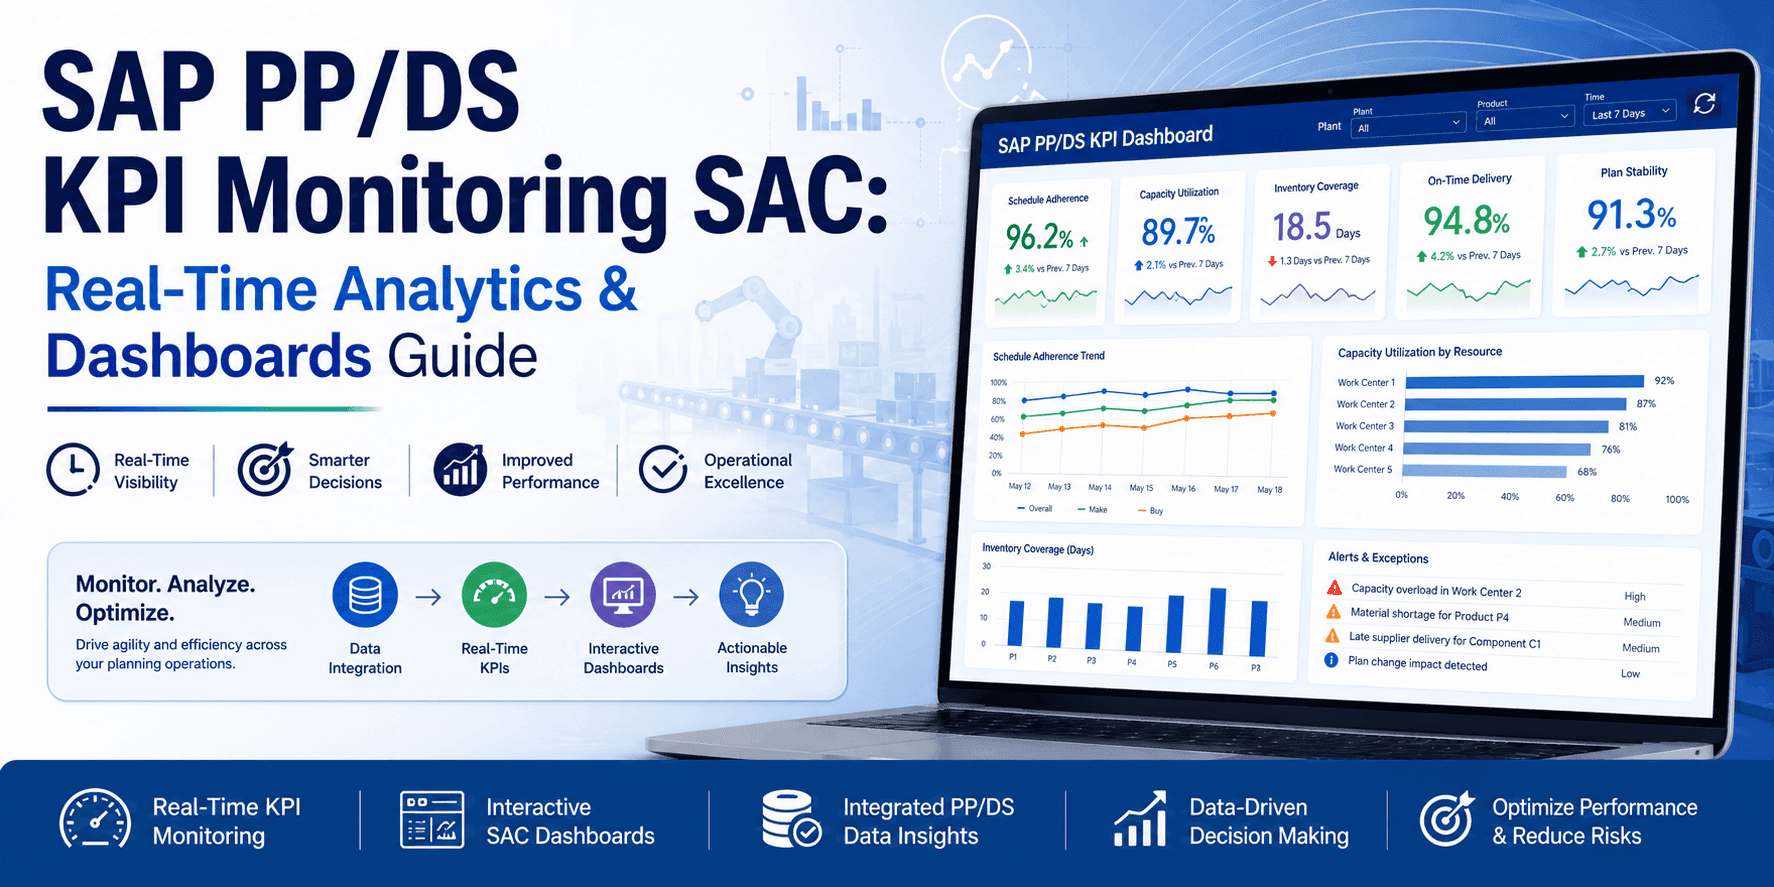
Real-Time KPI Monitoring in SAP PP/DS with SAC Integration
Introduction
Production planning has changed more in the last five years than in the previous twenty. What used to be a static, transaction-heavy process has now become a continuous decision loop powered by data. In this shift, SAP PP/DS KPI monitoring with SAC plays a central role.
Planners today are not just executing MRP runs or adjusting sequences. They are expected to monitor bottlenecks in real time, anticipate shortages, and respond instantly to demand variability. This is where traditional planning tools fall short—and where PP/DS analytics with SAC stories becomes critical. Professionals pursuing SAP PPDS Training can greatly benefit from understanding these modern analytics-driven planning approaches used in real-time manufacturing environments.
SAP PP/DS already provides deep planning capabilities, but without analytics, planners are effectively working blind. Integrating it with SAP Analytics Cloud (SAC) transforms raw planning data into actionable insights, visual dashboards, and predictive signals.
| Term | Meaning |
|---|---|
| KPI (Key Performance Indicator) | A measurable value that indicates how effectively planning objectives are achieved |
| PP/DS | Production Planning and Detailed Scheduling in SAP S/4HANA |
| SAC | SAP Analytics Cloud – SAP's cloud-based analytics and planning platform |
| MLTB | Multilevel Time Buffer – a KPI measuring buffer consumption across supply chain levels |
Quick Facts
- SAP PP/DS supports advanced KPIs like MLTB, resource utilization, and pegging visibility
- SAC enables real-time dashboards and interactive planning analytics
- MLTB is one of the most critical KPIs introduced for demand-driven planning environments
- SAC stories can be standard or fully customized for business-specific KPIs
Why KPI Monitoring Matters for Production Planners
The shift to data-driven planning
Planning is no longer about "running MRP and reviewing exceptions." It has evolved into a data-driven discipline where decisions are continuously refined based on real-time insights.
In modern manufacturing environments:
- Demand changes daily (sometimes hourly)
- Supply disruptions are frequent
- Capacity constraints are dynamic
Without KPI monitoring, planners rely on reactive decision-making. With KPIs, they move toward predictive and proactive planning.
For example:
- Instead of reacting to a stockout, a planner sees MLTB dropping early
- Instead of noticing overload later, resource utilization spikes immediately on dashboard
This is the difference between firefighting and controlled planning.
Visibility gaps in legacy planning
Traditional SAP planning environments—especially pre-S/4HANA—suffer from limited visibility:
- Data scattered across transactions
- No unified dashboard
- Delayed reporting cycles
- Limited cross-level visibility
Even in PP/DS, planners often depend on:
- Product view
- Planning board
- Order reports
These tools are powerful but not designed for KPI-driven monitoring.
This creates gaps:
- No real-time bottleneck alerts
- Poor visibility into pegging chains
- Difficulty measuring planning performance
SAC fills this gap by turning PP/DS into a visual, insight-driven system.
SAP PP/DS KPI Capabilities
Multilevel Time Buffer (MLTB)
MLTB is one of the most powerful KPIs in PP/DS.
It measures:
- Time buffer across multiple supply chain levels
- Delay risks before they become critical
It helps planners answer:
- "How close am I to missing demand?"
- "Where is the risk building in the network?"
Tank fill levels
In industries like chemicals, oil, or process manufacturing, tank utilization is critical.
PP/DS tracks:
- Fill levels
- Consumption rates
- Capacity constraints
With SAC dashboards:
- Tank levels become visual trends
- Critical thresholds trigger alerts
Resource utilization
This KPI answers a simple but vital question:
Are my machines overloaded or underutilized?
PP/DS provides:
- Capacity consumption
- Resource load
- Bottleneck identification
SAC enhances this by:
- Showing utilization trends over time
- Highlighting overload periods visually
Order pegging visibility
Pegging connects:
Demand → Supply → Production → Procurement
Without visibility:
- Root cause analysis is slow
- Impact analysis is difficult
With SAC:
- Pegging chains become visual
- Planners can trace delays instantly
SAC Stories for PP/DS
How SAC integrates with PP/DS
Integration happens through:
- CDS views (Core Data Services)
- OData services
- Data extraction pipelines
SAC consumes PP/DS data and transforms it into:
- Charts
- Tables
- Predictive models
Pre-built stories
SAP provides standard SAC content for:
- Supply chain KPIs
- Demand planning
- Inventory analytics
These include:
- Resource utilization dashboards
- Supply-demand balance views
They are useful starting points but often require customization.
Custom story creation
Custom SAC stories are where real value lies.
You can:
- Combine PP/DS KPIs with business KPIs
- Create role-based dashboards
- Add predictive analytics
Example:
A planner dashboard may include:
- MLTB trend
- Resource utilization
- Late orders
- Bottleneck alerts
Multilevel Time Buffer Deep Dive
What MLTB measures
MLTB measures time buffer consumption across supply chain levels.
In simple terms:
It tells how much delay your system can absorb
Higher MLTB = safer
Lower MLTB = higher risk
How to interpret MLTB values
| MLTB Value | Meaning |
|---|---|
| High | Healthy buffer, low risk |
| Medium | Monitor closely |
| Low | Risk of delay |
| Negative | Delay already occurring |
Planners use MLTB to:
- Prioritize orders
- Adjust schedules
- Prevent disruptions
Q1 2026 MLTB enhancements
Recent enhancements (Q1 2026) include:
- Better visualization in SAC dashboards
- Improved calculation across multi-level pegging
- Integration with demand-driven planning
- Faster real-time updates
These improvements make MLTB more reliable for real-time decision-making.
Setting Up SAC Integration
Prerequisites
Before integration:
- SAP S/4HANA system with PP/DS active
- SAC tenant configured
- Required authorizations
- CDS views activated
Data extraction
Steps:
- Identify PP/DS data sources
- Activate CDS views
- Expose data via OData
- Connect SAC to S/4HANA
Story creation
Steps:
- Import data into SAC
- Create model
- Build visualizations
- Add filters and KPIs
- Publish dashboard
Real-World KPI Dashboards
Bottleneck dashboard
This dashboard highlights:
- Resource overload
- Queue buildup
- Delayed operations
It helps planners:
- Identify bottlenecks early
- Reassign capacity
Capacity utilization dashboard
Shows:
- Resource load %
- Idle capacity
- Peak usage periods
Benefits:
- Better capacity planning
- Reduced idle time
Order pegging dashboard
Displays:
- Demand-supply linkage
- Delay propagation
- Critical orders
This improves:
- Root cause analysis
- Decision speed
Best Practices
- Focus on actionable KPIs, not just data
- Keep dashboards simple and role-based
- Use MLTB as early warning signal
- Combine heuristics + analytics
- Train planners on data interpretation
FAQ: PP/DS KPI Monitoring
What is SAP PP/DS KPI monitoring?
It is the process of tracking planning performance using KPIs like MLTB, resource utilization, and pegging visibility.
Why integrate SAC with PP/DS?
To enable real-time dashboards, visual analytics, and better decision-making.
What is MLTB in SAP PP/DS?
It is a KPI that measures buffer time across supply chain levels to identify delay risks.
Can SAC show real-time PP/DS data?
Yes, depending on integration setup and data refresh configuration.
Is SAC mandatory for PP/DS analytics?
No, but it significantly enhances visibility and decision-making.
How frequently should PP/DS KPIs be monitored?
KPIs should ideally be monitored in real time or at frequent intervals (hourly/daily) to quickly identify planning issues and take corrective actions.
What are the most important KPIs in SAP PP/DS?
Key KPIs include resource utilization, planning adherence, order delays, pegging relationships, and MLTB, as they directly impact production efficiency and service levels.
Can PP/DS KPI monitoring improve forecast accuracy?
Yes, by analyzing planning deviations, delays, and resource constraints, organizations can refine planning strategies and indirectly improve forecast accuracy.
Conclusion
The future of production planning is no longer limited to automation—it is driven by intelligence, real-time visibility, and predictive decision-making. Modern manufacturing environments demand faster responses to supply chain disruptions, fluctuating customer demand, and resource constraints. In this evolving landscape, SAP PP/DS KPI monitoring with SAC integration helps organizations move beyond traditional planning and adopt a more data-driven approach to manufacturing operations.
SAP PP/DS combined with SAP Analytics Cloud (SAC) bridges the gap between planning execution and business insight. It enables planners to identify production bottlenecks early, monitor shortages in real time, analyze resource utilization, and improve planning accuracy through interactive dashboards and visual analytics. Instead of reacting to problems after they occur, planners can proactively optimize schedules, reduce delays, and improve operational efficiency.
Key performance indicators such as MLTB (Material Location Time Balance), resource utilization, order delays, pegging visibility, and capacity constraints are no longer optional metrics. They have become essential components for managing a modern, agile supply chain. With SAC stories and dashboards, these KPIs are transformed into actionable insights that support faster and smarter business decisions.
As businesses continue investing in intelligent manufacturing and Industry 4.0 initiatives, SAP PP/DS is evolving from a scheduling tool into a real-time decision platform powered by analytics and automation. Professionals who want to stay competitive in this growing field should build hands-on expertise through a structured SAP PPDS course or advanced SAP PP/DS training program. Learning these practical planning and analytics concepts helps consultants and planners understand real-world manufacturing challenges and deliver more effective production planning solutions.
Author Bio:
The TechBrainz SAP PP/DS & Analytics Team consists of experienced SAP consultants specializing in production planning, KPI monitoring, and SAC integration. They deliver practical insights and real-world strategies to help organizations optimize planning performance and decision-making.